BY RANDY WILLIAMS
What’s the difference between R-Value and U-Factor?
You're probably aware of these measures of thermal performance but might be wondering how they differ, why U-Factor is used for measuring windows, and how to use these measures when selecting product. Here to explain is guest contributor Randy Williams.

We were taught in junior high that hot air rises, the key to that phrase is air. Heat itself moves from someplace warm to someplace cool. A good example of this happens often in cold climates. When standing in front of an old window on a cold night, you feel a chill. This chill is the result of heat leaving your body and moving towards the colder surface of the window glass, heat moving from hot to cold. To slow this movement of heat, we use insulation. By putting on another layer of clothes, we reduce or resist the movement of heat. In other words, when you put on a sweater, you’re adding R-Value.
What is the difference between R-Value and U-Factor?
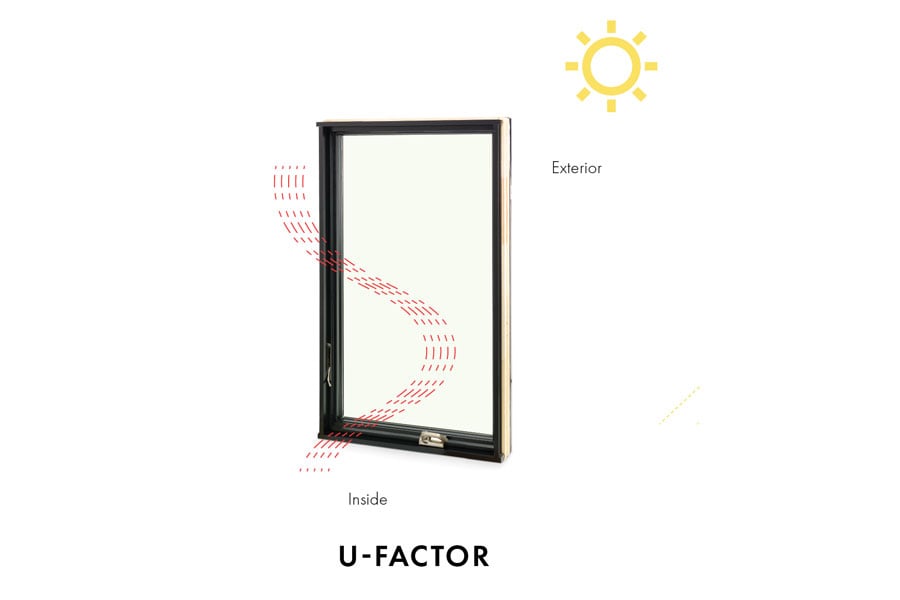
R-Value is the resistance to heat flow, conductive heat flow to be specific. With R-Value, the higher the number, the more resistance to the movement of heat — so bigger is better. The inverse of R-Value is U-Factor, which is another term that is commonly used to measure thermal performance.
U-Factor is the rate or speed of heat loss (or gain) that transmits through 1 square foot of building assembly or product (roof, floor, wall, window, etc.) in one hour with a 1°F temperature difference between the two sides. With U-Factor, the smaller the number, the slower the rate of heat loss — so smaller is better. It is measured on a scale from 0 to 1 with most U-Factors being less than one.
A typical window in my very cold climate of Minnesota might have a U-factor of .30. For some, U-.30 might not be relatable. We can convert U-factor to R-value with the simple formula: 1/U-factor=R-value. That U-.30 window will have an R-value of 3.33. We can also convert R-value to U-factor by the formula 1/R-value=U-factor.

Although both R-Value and U-Factor are used to measure components of a building’s assembly, you will usually find U-Factor used with windows and doors.
Why R-Value and U-Factor matter
R-Value and U-Factor help you understand how insulating various building materials will be, so they’re useful measurements when looking for an energy-efficient product. Window manufacturers are required to indicate the rate of window heat loss through their window assembly using the U-Factor value. This is the certified value that appears on the performance label that you’ll find on all Andersen® windows and doors. You can use this value to help you select products that will meet code requirements and project goals for energy efficiency and since this value is used across the industry, you can also use it to compare products from different manufacturers. Remember that when it comes to U-Factor, lower numbers are better.

U-Factor will be listed on Andersen performance labels, which include criteria that’s been established by industry groups, including the
National Fenestration Ratings Council (NFRC) — a nonprofit organization that promotes the advancement of energy-efficient windows,
doors, and skylights.
The reason U-Factor is the metric for windows is because a window is an assembly of products. The glass will have a different heat flow than the frame. We cannot simply add the R-Values of these different components together. We have to calculate both series and parallel paths through the different materials by using a weighted average of the U-Factors of the various pieces that create the window. These calculations get us into the weeds, so we won’t go there. Just be aware, calculating the insulation values of a window (or any assembly of products) isn’t as easy as simply adding R-Values together.
What is a good R-Value and what is a good U-Factor?
The answer is a phrase that I unfortunately have to say a lot, it depends. If you have a wall assembly that is insulated to R-30, I would say that is great! But that same R-30 makes for poor roof resistance to heat flow, and R-30 would be very difficult to achieve in a window. The code minimums in the 2021 IRC are good achievements, but if you are looking to build above code, the 5-10-15-30-60 rule is what I suggest. R-5 windows (U-.20), R-10 under slab insulation, R-15 slab edge/foundation insulation, R-30 wall insulation, and R-60 in the roof.
Let’s dive a little deeper into the wall assembly and how the building materials, insulation, and windows affect performance. Most common walls in the residential market are constructed using wood framing lumber, typically 2 x 4 or 2 x 6. The framed cavities are filled with insulation. The outside is usually covered by sheathing, such as plywood or oriented strand board (OSB). There may or may not be a layer of continuous exterior insulation. The exterior will have cladding to protect the moisture-sensitive surfaces of the inner wall. The interior side of the wall will have some sort of finish, drywall is most common. All these surfaces and products have an insulation value. Cavity insulation will have a higher resistance to heat flow than wood framing. Because of this, the actual R-Value of the entire wall is different than the listing for the cavity insulation. The code may require that the insulation value of a wall be R-20, for example, but the actual R-value will usually be something less. When we calculate the lesser R-Values of wood framing (and windows and doors) compared to the higher insulation value of the insulation, we produce what is called the effective R-Value.
The effective R-Value, (sometimes called area weighted average) is the whole wall resistance to heat flow which takes all the building components into account.
How do you calculate R-Value?
The R-Value is the reciprocal of the U-Factor. If you are simply looking to calculate the R-Value of a window or door, you can take the U-Factor and calculate the R-Value using this equation: R=1/U.
However, if you are seeking to understand the effective R-Value, explained above, it’s more complex and beyond the scope of the article. But be aware it requires knowing the area of framing, the area of insulation, and area of windows and doors of the entire wall assembly. You also need to know the U-Factor of each of these components. What starts off as an R-20 wall might end up being R-12 or less by the time all the component insulation values and ratios are calculated. The effective R-Value is needed when calculating the heating and/or cooling needs of the structure.
How do you achieve the best possible effective R-value?
Here are a few suggestions:
- Move as much of the insulation to the outside of the structure as possible. When insulation is outboard of the framing, the effect of thermal bridging can be reduced.
- Use an advanced framing technique, where framing members are spaced on 24” centers rather than the traditional 16” center.
- Windows with lower U-Factor ratings and lowering the window to wall ratio can also help.
R-Value and U-Factor are two important subjects that builders should know. Knowing that a wall’s performance with regards to heat flow is much lower than the listed R-Value of the wall’s insulation is a topic that is often misunderstood. The choice of insulation levels and the location of that insulation in the wall assembly, framing type, size, and spacing along with the selection of a quality window or door will all affect comfort, cost, and even the durability of the structure.
Randy Williams started his construction career in the mid-1990s installing electrical, plumbing, and HVAC systems with his brother. In the early 2000s, his family branched into building and renovating homes. By 2005, Randy was working full time as a general contractor. He furthered his education in 2009 becoming an energy auditor. Today, Randy works with other contractors, homeowners, and utilities performing energy audits, building diagnostics, energy design, and code compliant testing, and assisting in the design of energy-efficient homes. He is also a contributing author to several trade publications and occasionally teaches home diagnostic testing and building science topics at different trade shows and training events.

Related articles

Get window and door performance details
